EFA on full and Subgroup Data
As our data is about the survey filled by employees who are at trainee level as well as employees who are at senior positions, to avoid the results of biasness about the survey filled by employees for their own level leaders, we subgroup the data here.
So, we perform the EFA for both the years on subgroups of data with trainees and seniors. Also, to check any difference, we perform the EFA on full data for 2014 and 2019 as well.
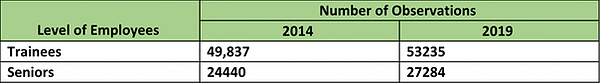
Let's start with raw data with all observations:
EFA Assumptions
Before performing EFA, the datasets need to satisfy the following two assumptions:
-
Sampling adequacy
-
Correlation adequacy
For checking Sampling adequacy, KMO test is udsed, while for correlation adequacy, Bartlett's test of sphericity is used.
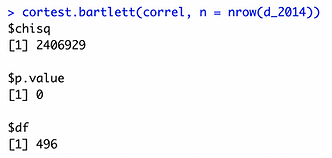
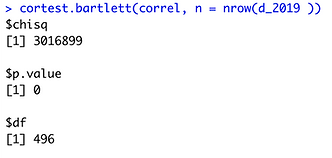
Bartlett's Test of Sphericity

Bartlett’s test of sphericity is used to test whether the correlation matrix is an identity matrix. An identity correlation matrix means your variables are unrelated and not ideal for factor analysis.
H0: Correlation matrix is an identity matrix
Ha: Correlation matrix is not an identity matrix
KMO - Sampling Adequacy
Sampling Adequacy is measured by KMO test, to predict if data are likely to factor well, based on correlation and partial correlation. KMO values closer to 1.0 are considered ideal. However, the minimum acceptable KMO value is 0.6, for proceeding with EFA.

The following are the results of performing KMO on both datasets:
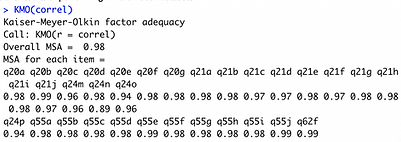

In both datasets, the overall KMO value is 0.98 indicates that the degree of information among the variables overlap marvelously with the presence of a strong partial correlation. Therefore, it is possible to conduct EFA.
The “chisq” values are significantly high and p < 0.05, which indicates correlation matrix in both datasets are not identity matrix and therefore, the datasets are suitable for EFA.